

Prestige
20021118-Prestige-models

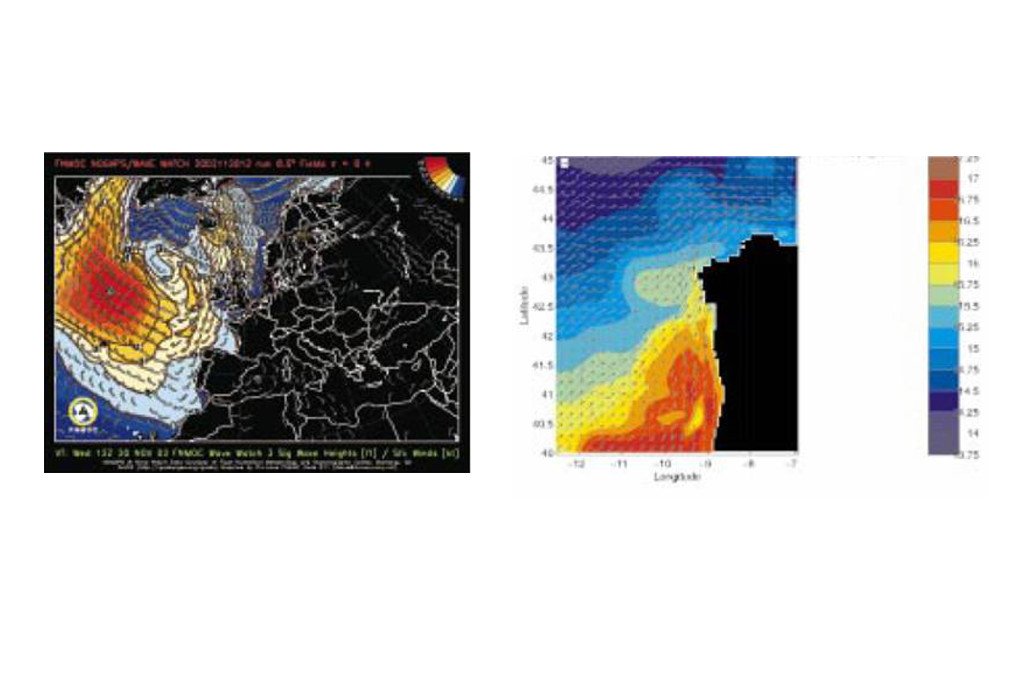
HOPS and FNMOC forecasting models
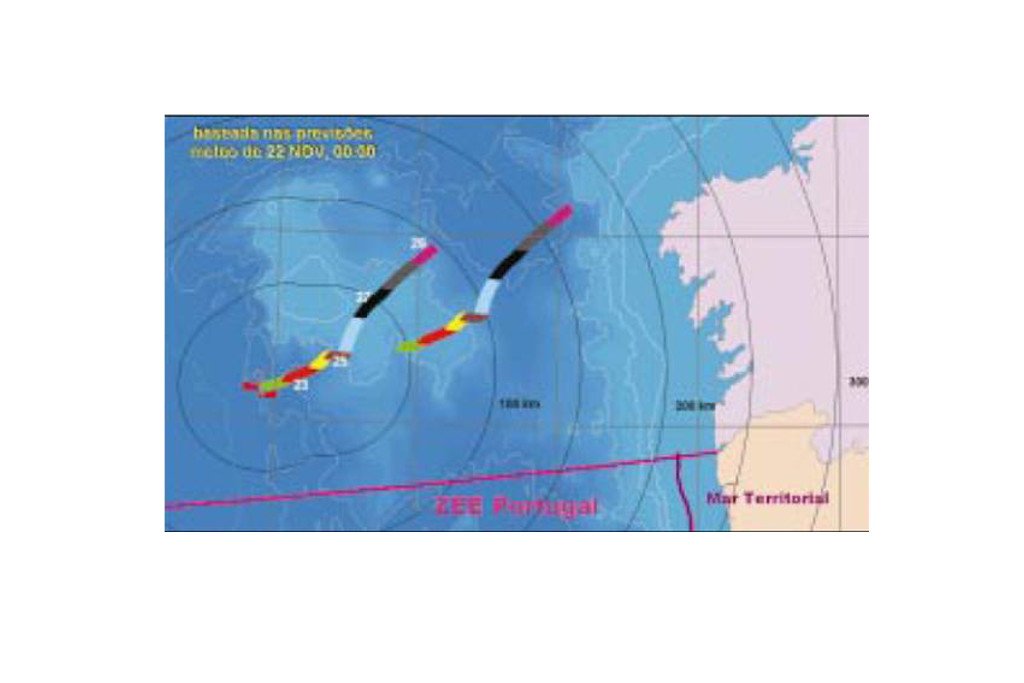
Drift forecast November 22 - 3 days after the Prestige sink
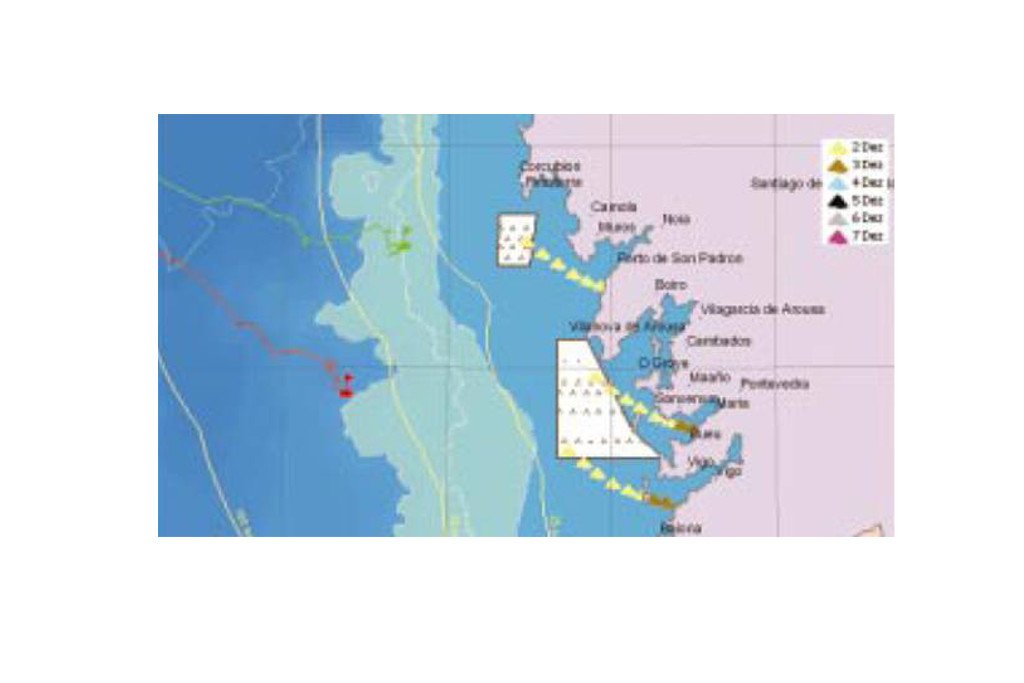
December 2, arrival of the pollution stain on the Galician coast - 13 days after the Prestige sinking
Maximum drift of wind south of the spot reached the Galician coast
On 13 November 2002, the 243-metre oil tanker Prestige, carrying 77,000 tonnes of fuel, suffered a breach in its hull off Cape Finisterre. After the crew abandoned the vessel, it eventually sank on 19 November, approximately 240 km west of Vigo. On 14 November, the Hydrographic Institute (IH) began monitoring the situation, carrying out the first forecast of the drift of the fuel spills identified by Spanish surveillance units. Subsequently, on 18 November, an operational structure was activated at the IH to ensure the acquisition, processing, production and dissemination of relevant technical and scientific information. This technical–operational structure consisted of a core team of 12 members — 10 from the Oceanography Division and 2 from the Technical-Scientific Data Centre — as well as staff from other functional areas of the IH, such as the Multimedia and Public Relations Offices.
In order to predict the drift trajectories of the fuel slicks, the IH used as its main tool the DERIVA model, developed by the Oceanography Division. This model essentially considers the effect of wind on objects floating on the water’s surface and the influence of sea agitation. To validate the model’s results, four floating systems equipped with satellite positioning systems were deployed, both by helicopter and by ship, near the sinking site. These systems proved to be very useful, and this methodology was later adopted by the French and Spanish agencies responsible for monitoring the Prestige incident.
Since the basic DERIVA model is more suitable for open-sea situations, two other models developed by the Oceanography Division within the scope of the MOCASSIM and PAMMELA2 scientific projects were used to adjust it to coastal phenomena: the HOPS (Harvard Operational Prediction Survey) circulation model, which allows the forecasting of surface and subsurface currents, and the SWAN (Simulating Waves Nearshore) coastal wave prediction model, which also makes it possible to estimate breaking characteristics and longshore drift currents. Meteorological forcing in these two models was carried out using weather and sea-state data from the United States Navy (FNMOC) and/or European meteorological centres. Meteorological information from the high-resolution French model ALADIN, provided by the Meteorology Institute, was used to feed the HOPS model.
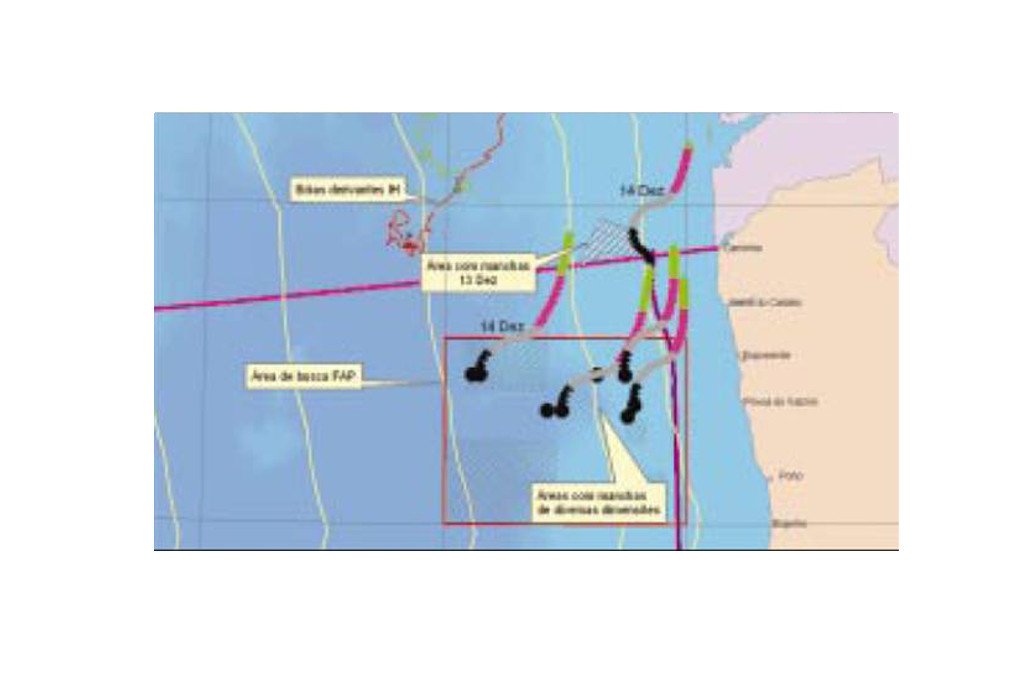
For the storage, processing, integration, analysis and presentation of the information gathered by the monitoring cell, the IH used Geographical Information Systems (GIS). The data included in the GIS originated from base cartography; detection and location of the spill traces obtained from aerial surveys by the Air Force and Navy vessels; the drifting systems launched and tracked via a constellation of satellites that transmitted positioning data daily; satellite images provided by the European Space Agency (ESA); and the drift forecasts of the spill traces calculated from the models.
All this information was efficiently integrated into ESRI’s ArcGIS 8 system, enabling a highly flexible analysis of the situation and providing a clear overview of the incident’s status at each stage. Daily reports, maps and images were produced and used in press conferences, as well as made available in digital format via the Internet to the media and to national and international scientific activity centres.
232